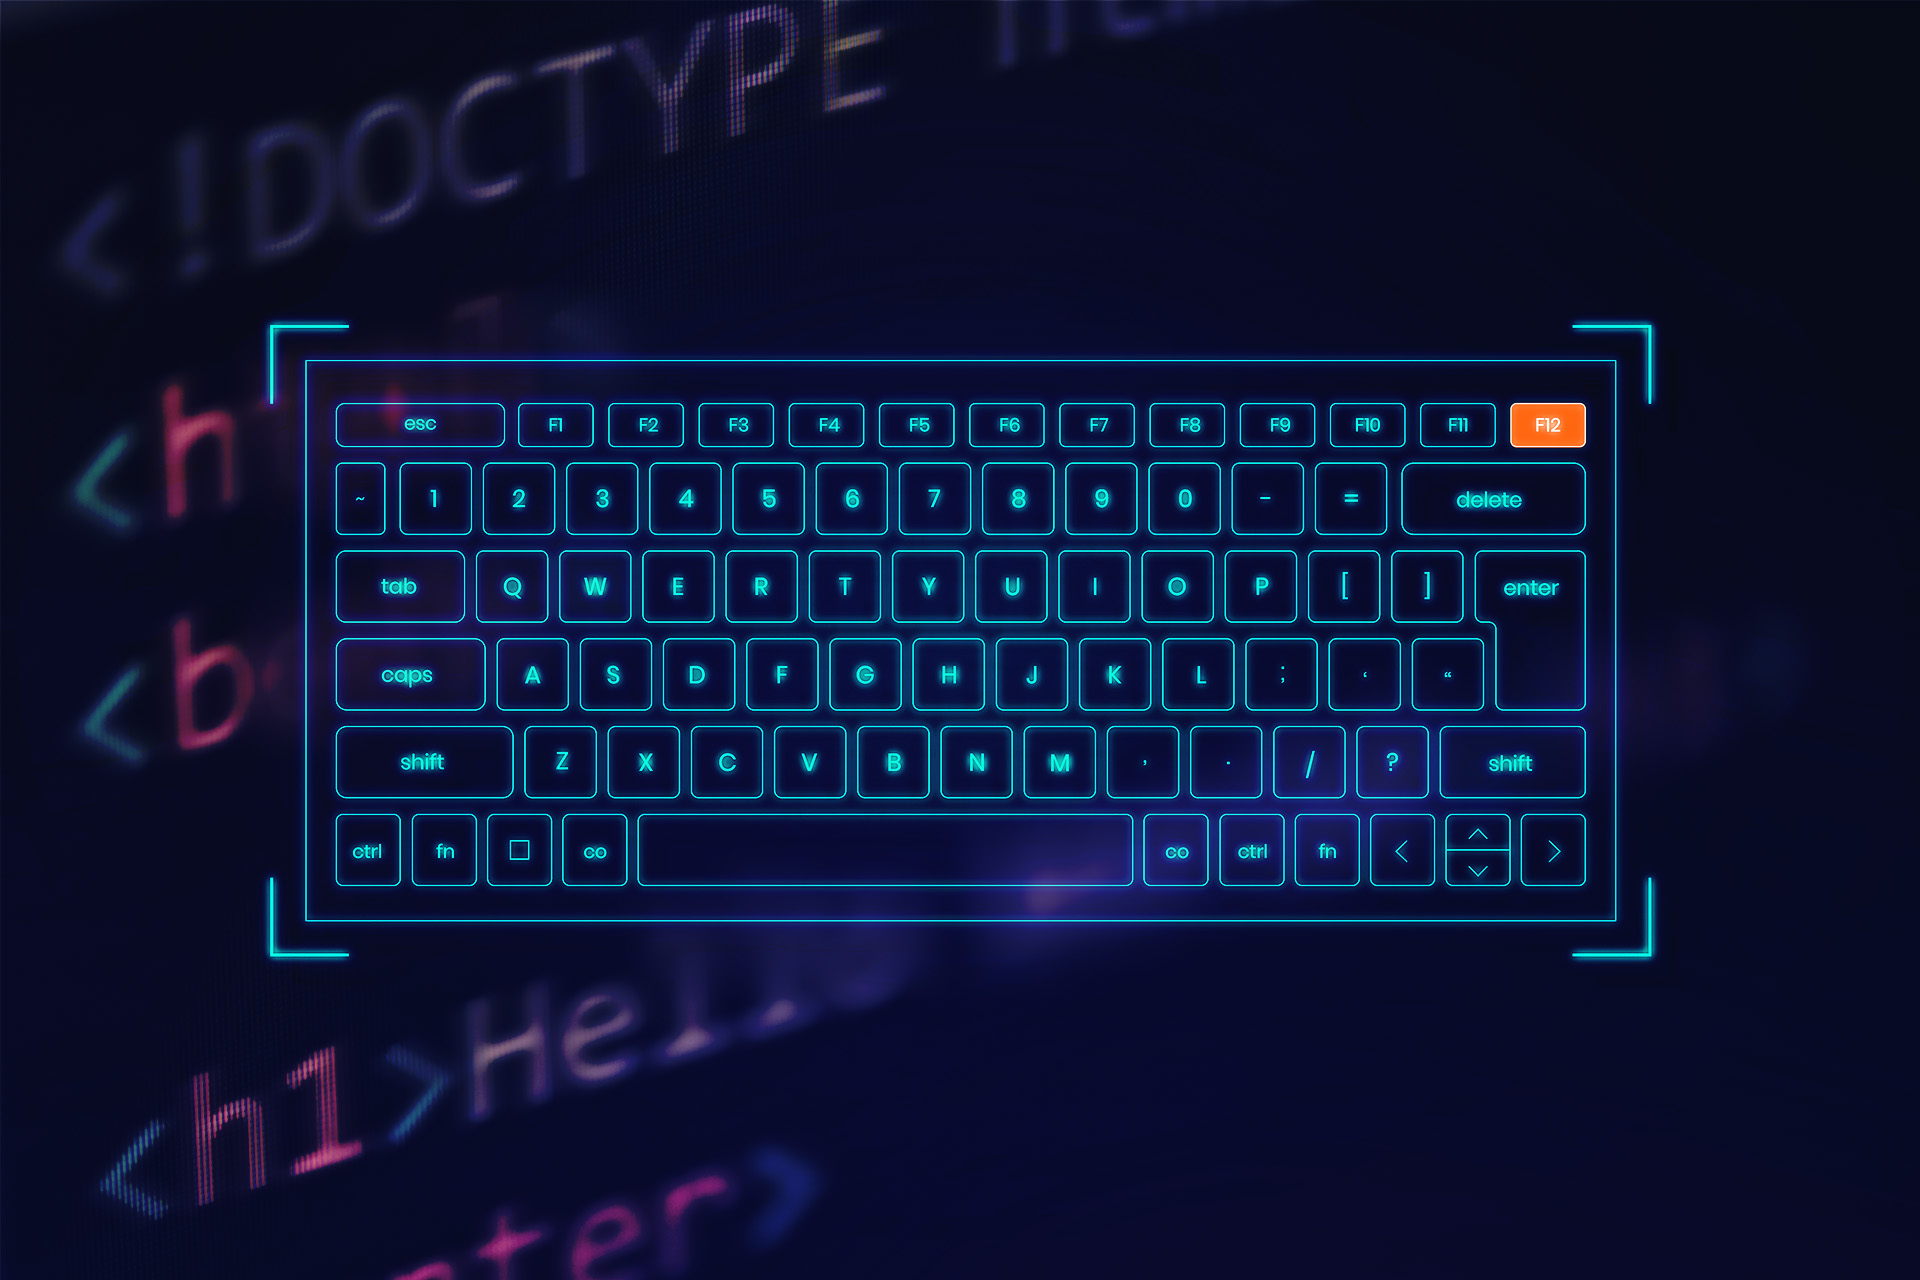
There’s a powerful set of tools hiding just beneath the surface of your Chrome browser. Press F12, and you’ll unlock an entire arsenal available to web developers: Chrome DevTools. Whether you are searching for pestering bugs or you want to improve performance, these tools can assist you in your developer journey. Levi9’s Cristian Hasna, software developer, and Silviu Miron, frontend developer, walk you through the most important features of these tools.
“The developer tools are the standard output of your application. They are used to view all logs from the application, which can include warnings, information, errors, and more,” explains Cristian. These tools, while individually very valuable, also function together to create a debugging environment that is more effective than just the individual components.
Console: Your View into the Inner Workings
If DevTools were a house, the Console would be like the living room—this is the place where everyone comes together. This tab acts as the voice of your application, showing all it wishes to communicate with you (or, at times, what it may be attempting to conceal).
“The console functions as a JavaScript REPL (Read-Evaluate-Print-Loop),” allowing you to interact with your application in real-time. You can access DOM elements, execute JavaScript, and even create live expressions that continuously evaluate as your application runs, notes Cristian.
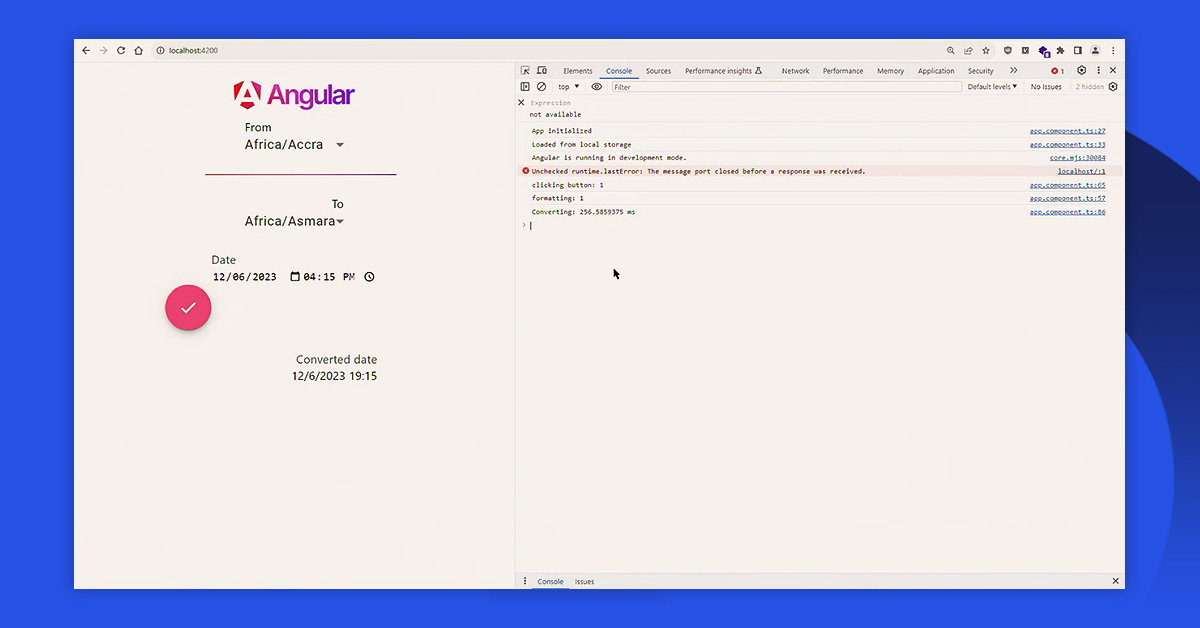
The main features of this panel are:
Monitor execution: console.log() is the most popular method for general debugging;
Highlight errors: console.error() displays messages in bright red, so that you can easily identify them troubleshooting;
Organize data: console.table() transforms data into well-structured, readable tables;
Monitor variables: Live Expressions create constantly evaluating statements that update in real-time as the application runs.
The console is not only for listening. It also responds. “You can interact with the application directly from the console and access the whole HTML structure of the page,” Cristian outlines.
Elements: Preview Styles
The Elements tab acts like X-ray vision for your webpage. It shows the skeleton (Document Object Model – DOM) and clothing (CSS) of your application, enabling you to make changes to both.
“Elements is excellent at debugging all things related to CSS, which makes it excellent for prototyping,” says Cristian. “Instead of going to your text editor, saving, refreshing the page, seeing if it changed, and going back to the editor when you make a mistake, you can do all this directly in Elements.”
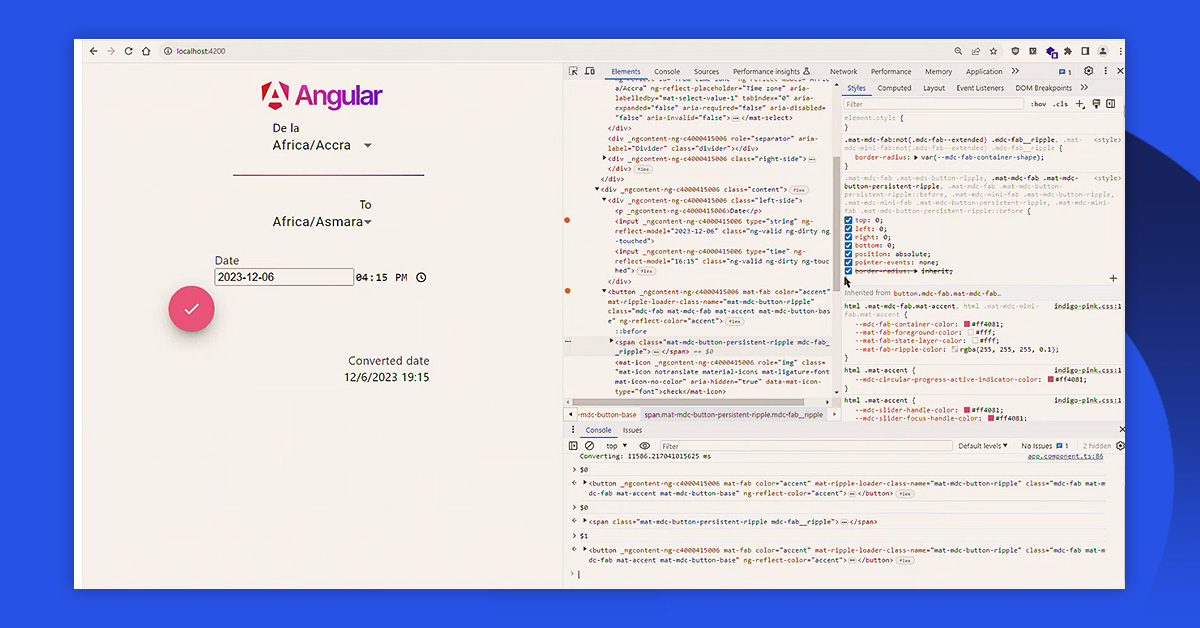
This tab stands out in many aspects:
Live editing: You can add, remove, or change HTML elements and attributes and see your page react in real time;
CSS try-out: Try out styles without modifying your stylesheets. Switch properties on and off, change values using the arrow keys, or create completely new rules;
State simulation: Force elements go into :hover, :active, or :focus states, so that you can see and edit how the element looks while in that particular state;
Execution breakpoints: You can set breakpoints that pause JavaScript when elements change. This comes in handy for finding the bits of code that cause unexpected changes.
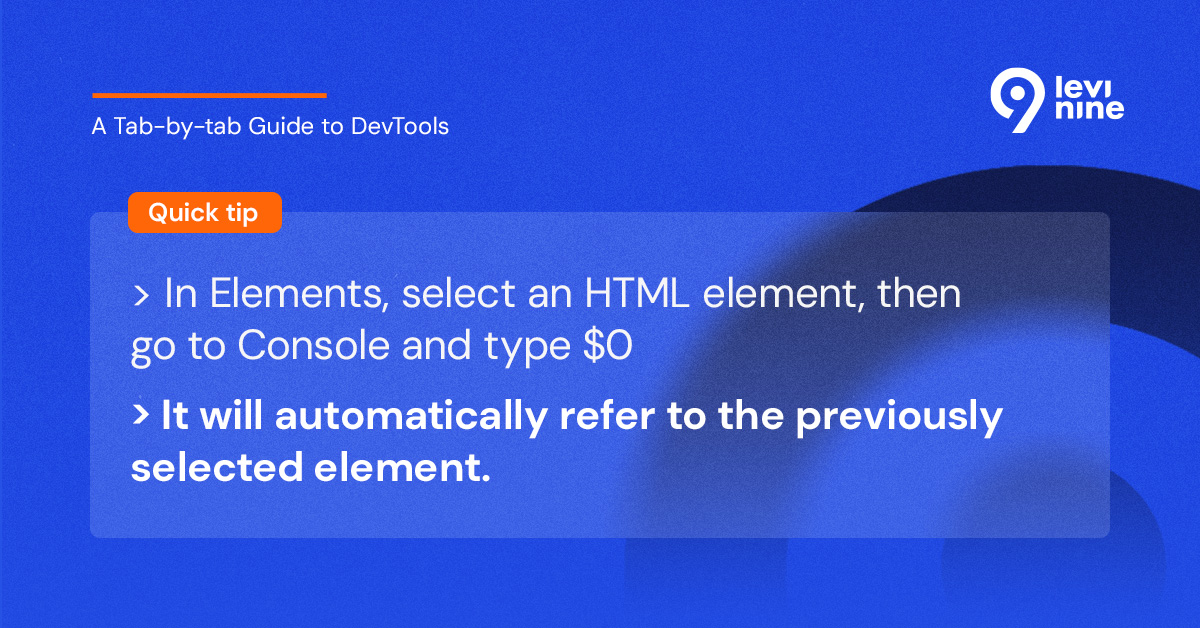
“If you want to create a prototype quickly without needing to go to your editor, you can choose an element and interact with it directly by using $0.focus() or $0.click() to mimic different events,” Cristian Hasna recommends. It’s a handy shortcut that can save some time while testing out changes.
Sources: Execute Code Step by Step
The Sources tab acts like a time machine for your code. This feature lets you pause execution, go through instructions step by step, and inspect variables at different points.
“Sources interact with the JavaScript that is behind the application.” It allows us to pause the execution of code at specific breakpoints that we set,” explains Cristian. “We can see the call stack, understand which function calls happened before we reached our breakpoint, and track the execution flow.”
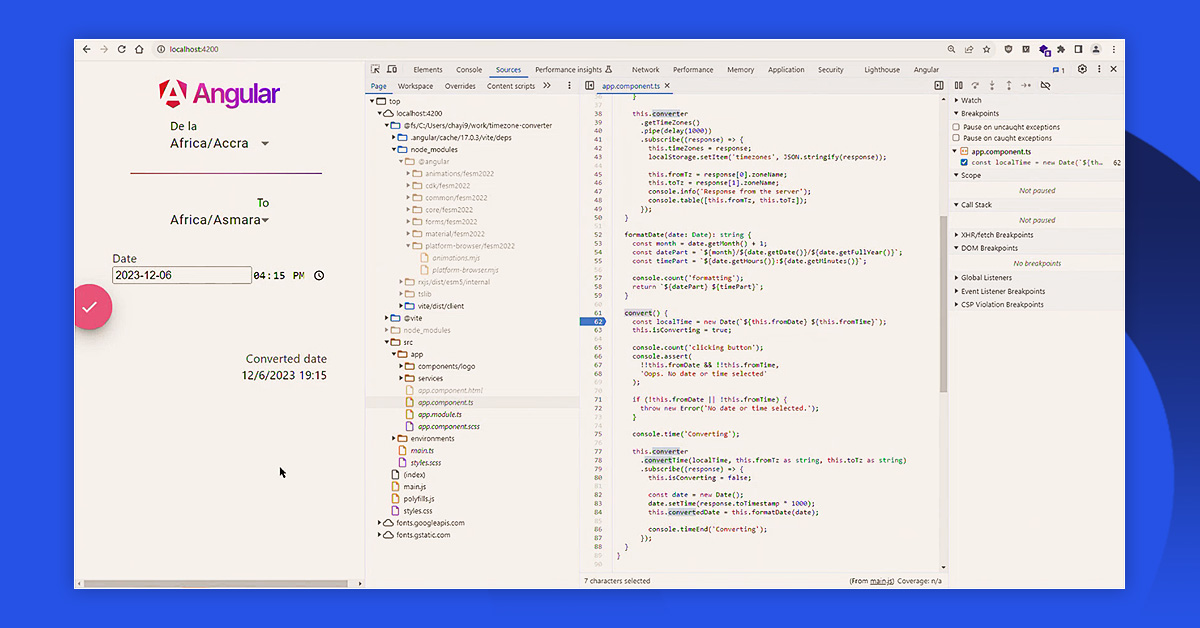
This tab allows you to understand your app through several methods:
Control of execution: Place breakpoints at the locations where you want the code to stop, then proceed to go through it line by line, into functions, or until the next breakpoint;
Call stack visualization: See the sequence of function calls that led to the current point;
Variable inspection: You can hover over variables to view their values, or you can add them to the watch panel to monitor them continously;
Code snippets: Create, save and run frequently used pieces of code.
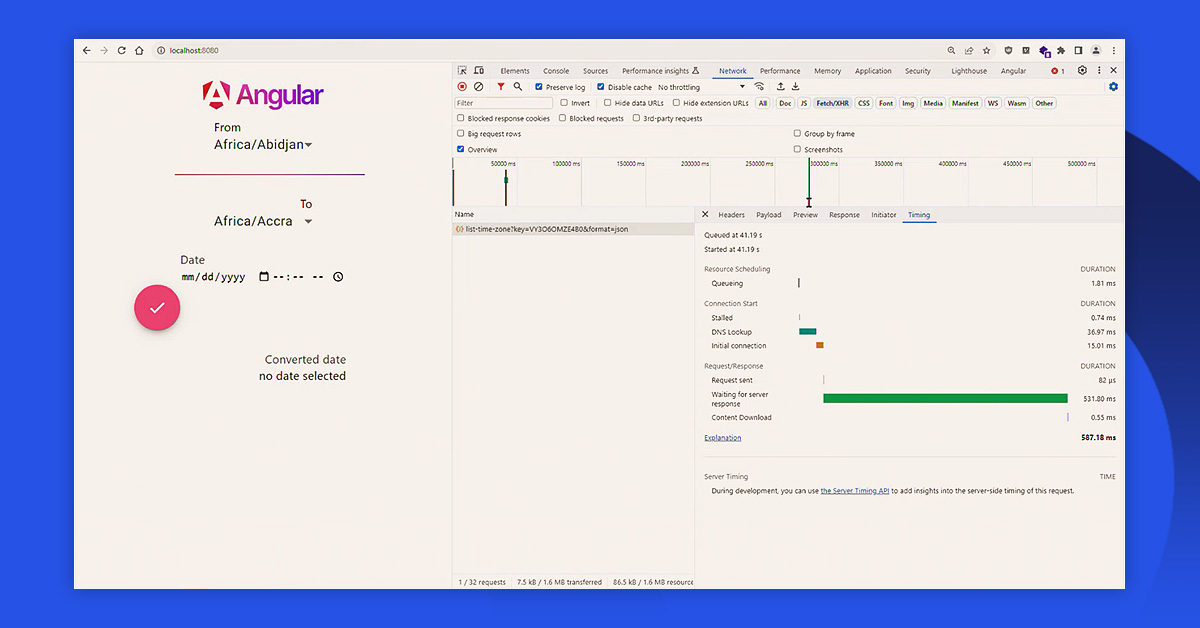
Network: Simulate Internet Conditions
The Network tab acts like a control tower for your application’s traffic, keeping track of each request that goes out from your page and every response that comes back.
“The Network tab interacts with all requests leaving our application. It shows the history in a waterfall view,” Cristian demonstrates. “You can throttle to simulate a worse network and block certain requests to simulate backend failures.”
There are several things you can do in this tab:
Track requests: Look closely at all details of each request, including headers, payloads and timing
Analyze response codes: 200 is good, 300 is a redirect, 400 is client issue, 500 means there are server errors;
Evaluate performance: You can see clearly how long each network operation takes, divided into connection time, waiting time, and download time;
Simulate network speed: Find out how your application works on all kind of internet speed conditions;
Trace requests: This feature helps to identify which part of the code started each network call, allowing you to find any unnecessary or duplicate requests.
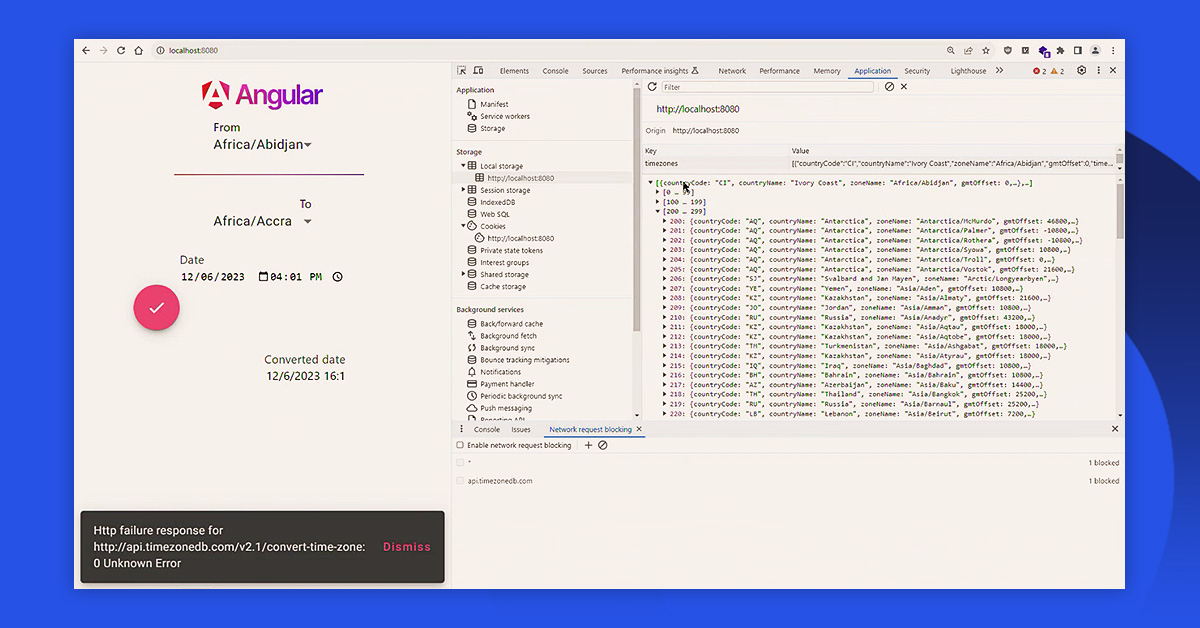
“You can simulate a server failure to observe how your application would respond if requests fail, which assists in identifying resilience issues,” advises Cristian.
Application: Storage Command Center
The Application tab is the main control center for all the data that your application keeps in the browser.
“Application interacts with storage in our application. Storage can be of several types depending on needs – localStorage, sessionStorage, cookies, and more,” details software developer Cristian Hasna.
Here are some things you can do in this tab:
Inspect LocalStorage: View and modify data stored permanently in the browser;
Manage SessionStorage: It allows you to view and change information that is only kept during the current browsing session;
Monitor the cookie jar: Check, make, change, or remove cookies, along with all their properties and expiration settings;
Observe service workers: Keep an eye on the scripts that allow offline functionality;
Clear site data: Delete the data that was stored during testing.
“LocalStorage remains available permanently unless the browser is uninstalled or cleared by the user, while SessionStorage lasts only for the duration of the user’s session,” Cristian explains. “Cookies are special because they are sent as headers with each request made by the browser, so we must be careful about what we store in them.” This difference is very important when making a decision about where to keep various kinds of data.
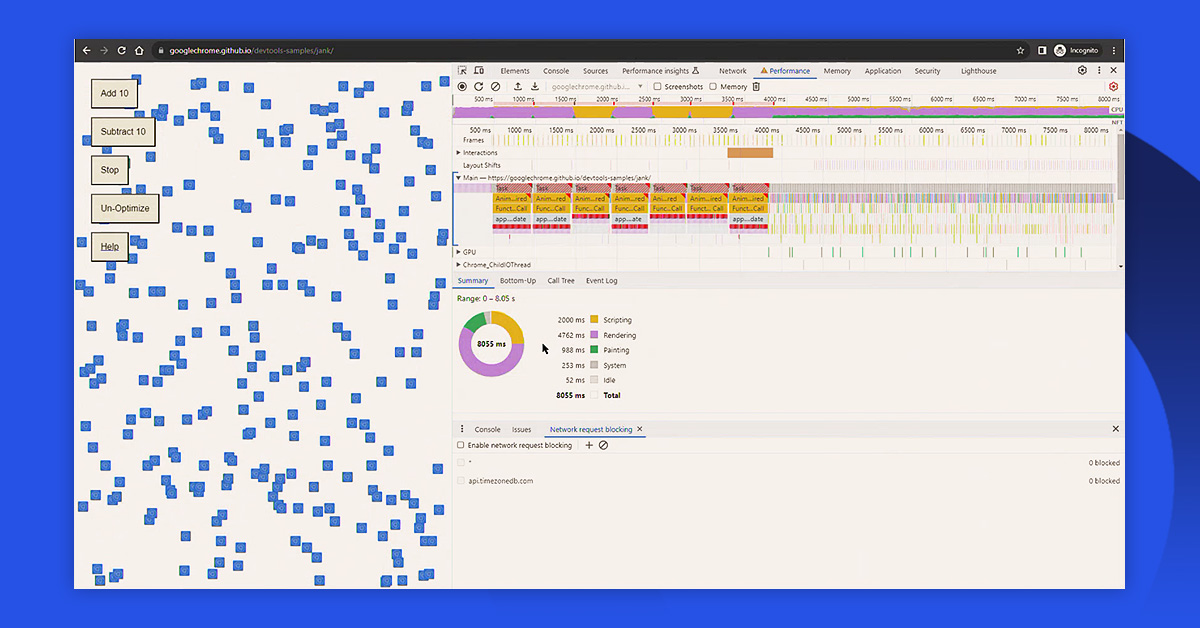
Performance: Find the Bottlenecks
The Performance tab is similar to placing a stethoscope on your web application. It shows how well its heart (CPU) is working and how smoothly its lungs (rendering engine) are functioning.
“The performance tab is used to record the application performance with step-by-step execution times,” Silviu Miron continues. “You can throttle the CPU and find performance bottlenecks.”
By using the Performance tab, you can:
Record activities: Collect detailed timing information while your application operates in various scenarios;
View resource usage: Understand precisely where CPU time is allocated and how it impacts frame rates (FPS);
Analyze the main thread: Find long-running tasks that block the user interface;
Find bottlenecks: Identify the exact functions or operations that slow down your application.
When we search for performance issues, we examine CPU and FPS. “If these have dropped significantly in a certain portion, it means that portion is a problem.”
Lighthouse: The Report Card
If the Performance tab is like a stethoscope, then the Lighthouse provides a complete medical checkup with a detailed health report.
“Unlike the Performance tab where you make a recording, in Lighthouse you run an audit that gives you a score on how well your application performs,” Sivliu explains. “Lighthouse also gives you tips on how to improve performance.”
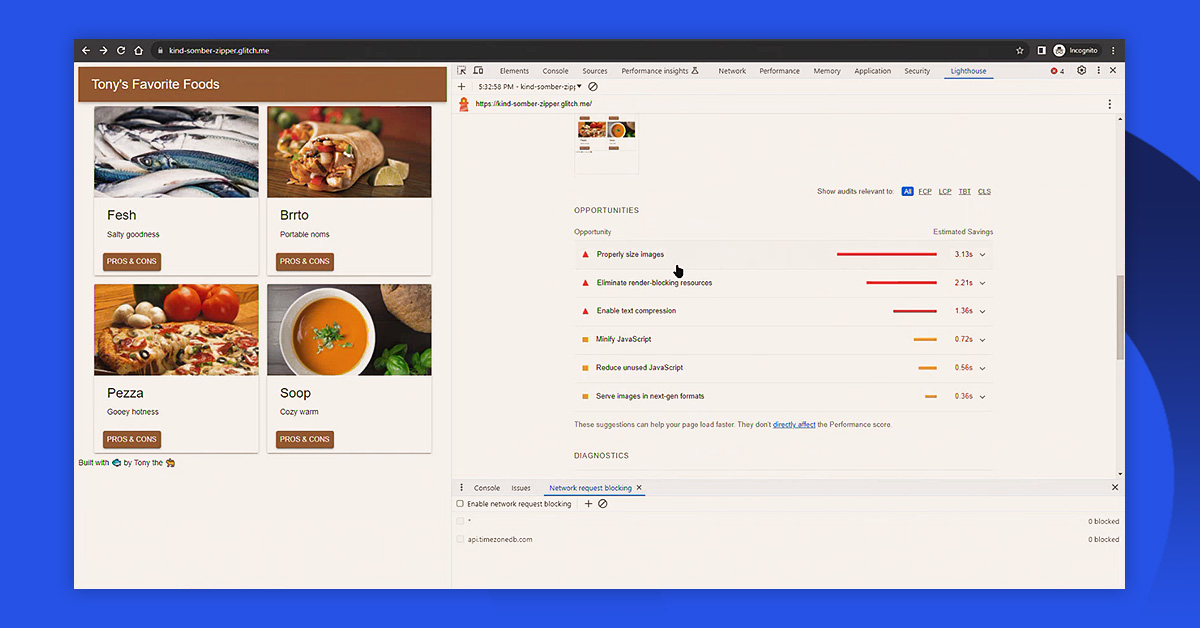
This tool for automated auditing assesses:
Speed: How fast does your application load and start to be interactive?
Rendering metrics: When does the content start show up, and how consistent is the layout while the page is loading?
Accessibility: Are users with disabilities able to use your application effectively?
SEO readiness: is your website easy to find and rank in the search engines?
Best practices: Is your application adhering to recognized web development standards?
“When we want to improve an application’s performance, it’s important to have a baseline. Before making improvements, we should run an audit to see where we stand,” advises Silviu.
Chrome DevTools is greater than just the combination of its components. The tools work together to find insights that no single instrument can provide by itself. Next time you are hunting for a bug in your code editor, take a moment to press F12 and let DevTools help you locate the main issue.
In this article: